HowTo: Debugging the WRK in a Virtual Machine
Windows Research Kernel @ HPIAt HPI we use the WRK for our operating systems courses. An
essential part in our exercises is to extend and debug the WRK,
which is why we prepared some slides for our students on how to
configure a kernel debug session. Unfortunately the slides are in
German. As Google's translation service quality is questionable in
this regards, we briefly recap all necessary steps here.
Resources
This HowTo uses the Debugging Tools for Windows suite and WinDbg in particular. Also we show how to configure VMware Server and Microsoft Virtual PC in this tutorial. Other VM vendors might work as well.
On Mac OS X systems, we were able to install the WRK only in VMware Fusion version 1.1.3. Parallels Desktop did however not work!
We further assume that you have already set up your virtual machine such that you can boot the WRK. But this is easy 🙂 - just follow the provided readme.txt file.
Configure the WRK for Debugging
In the virtual machine where you installed the WRK, open the boot.ini file which is in the root directory of your system partition, say C:\. It may look like this:
[boot loader]
timeout=30 default=multi(0)disk(0)rdisk(0)partition(1)\WINDOWS

[operating systems]
multi(0)disk(0)rdisk(0)partition(1)\WINDOWS="Windows 2003" /noexecute=optout /fastdetect

multi(0)disk(0)rdisk(0)partition(1)\WINDOWS="WRK" /kernel=wrkx86.exe /hal=halmacpi.dll /debug /debugport=com1
You should be familiar with the kernel and
hal switches. More important here is that you specify
that the WRK should boot in debug mode. This is exactly what the
debug switch does. You can also specify where a kernel
debugger will connect to the kernel. This can be either com1, com2,
or 1394 (Fire Wire). In a virtual machine, com1 is sufficient for
debugging purposes, so we specify the switch
debugport=com1.
Configure the Virtual Machine
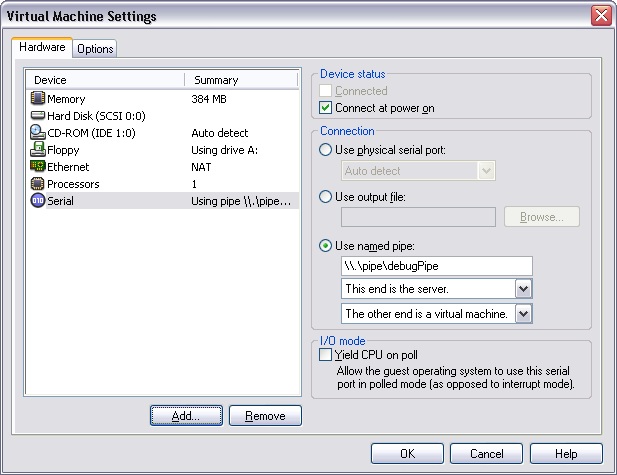
In your preferred virtual machine vendor, you need to create a serial port which we then map onto a named pipe. Doing so allows us to connect the virtual machine with the outer world, i.e. the kernel debugger. The following image shows a summary of the serial port settings for VMware server.

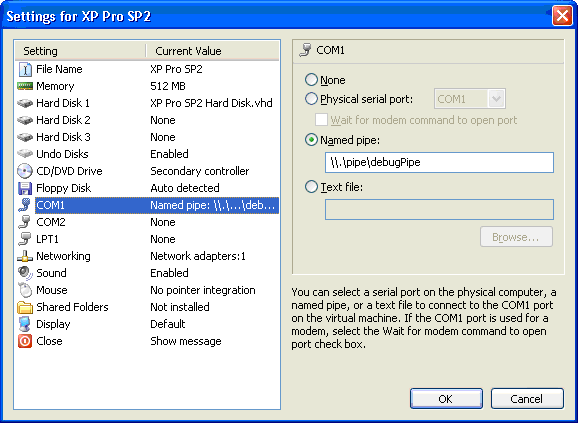
Alternatively, you may configure a serial port in Virtual PC:
 .
.
Configure the Debugger
Last but not least, you need to configure the kernel debugger on the host machine your WRK virtual machine is running on. We recommend writing the following batch file for starting WinDbg:
@echo off
set wrksymbols=%wrkpath%\base\ntos\BUILD\EXE
set dbgpipe=\\.\pipe\debugPipe
set dbgargs=-k com:pipe,port=%dbgpipe%,resets=0,reconnect -y %wrksymbols%
windbg %dbgargs%
The wrkpath variable should point to where you
installed the WRK on your hard disk. Typically this is
C:\WRK-v1.2. It is important to set this variable
before your start the batch file. When you start WinDbg with this
batch file and afterwards launch the virtual machine with the above
mentioned settings, you should see the following screen in
WindDbg.
That's it. With the above mentioned steps you can easily connect to your virtual machine and debug your WRK modifications. Should you encounter any problems following this tutorial, please let us know.
Comments
2 Responses to "HowTo: Debugging the WRK in a Virtual Machine"
Thank you,sir.
I want to know how to modify the WRK.Our teacher told us that we could add a "HANDLE" in ps.h to see the change with Windbg,but when I just declated a "HANDLE" in ps.h,I even can't log in the WRK mode.
Hi,
what should the handle be used for? And what kind of change do you want to observe with WinDbg?
Regards,
Alex