Results #
Scale-Out Benchmarks #
The scale-out benchmarks are used to test the performance of the prototype in a real-world scenario where communication needs to flow over a real network. Two main challenges occurred during the conduction of the benchmarks.
Since Kubernetes is an orchestration tool which automatically deploys the peers on nodes based on resource usage, one cannot manually assign the number of peers on a specific node. While it is possible to declare how much RAM and CPU a peer will be using on a node, even then the peers were not uniformly distributed. This resulted in a situation where on some nodes four or five peers were deployed, while on others only one was deployed. Unfortunately the performance of our nodes was only good enough to deploy 2 (for 4 GB RAM) or 3 (for 8 GB RAM) peers per node. Additionally our monitoring infrastructure had to be deployed on a node not running any peers to allow for stable monitoring. This problem was bypassed by creating a dedicated peer-deployment file for every host, which resulted in more work when changing deployment settings.
The second challenge was storage limitations. Since our nodes only had 32 GB of storage and the prototype implementation creates around 10 GB per hour per peer we were not successful in running any excessively long benchmarks. This can be examined in the stagnation of the accuracy during the benchmark in the following figures:
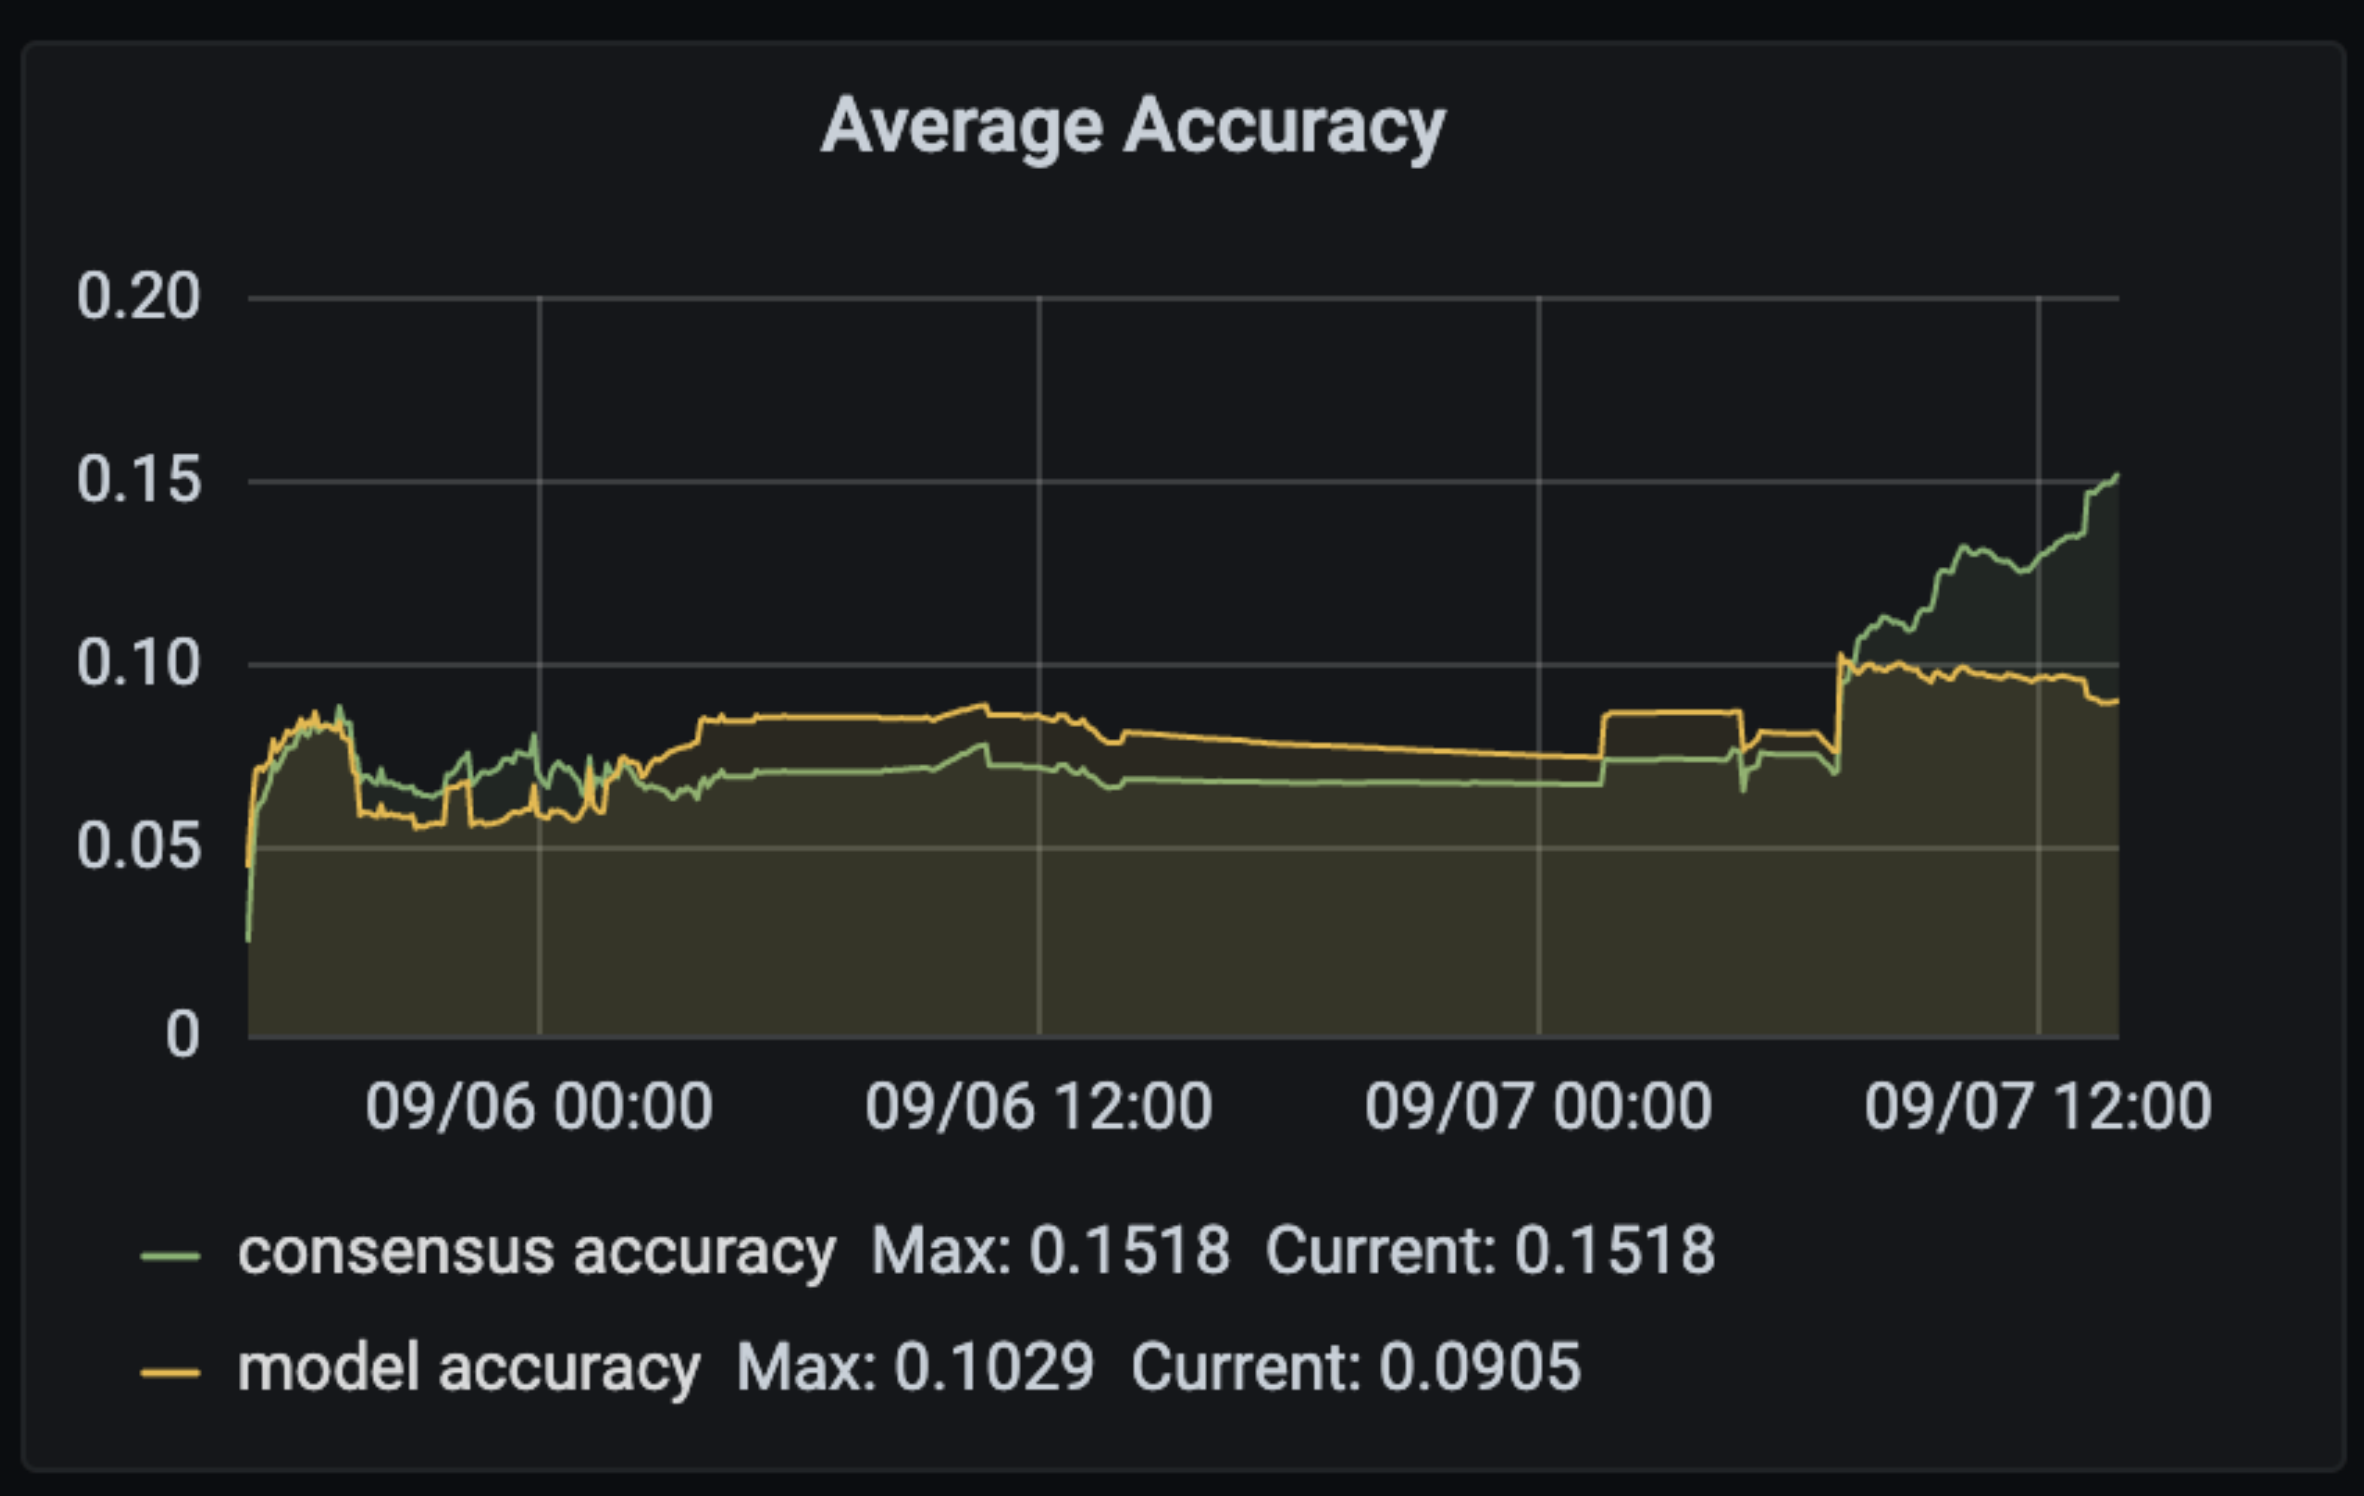

Both graphs show that the system runs well for the first 2 hours. After the first two hours progress starts to stall. It also indicates that Kubernetes' ability to kill pods in order to free resources if needed takes a while to react.
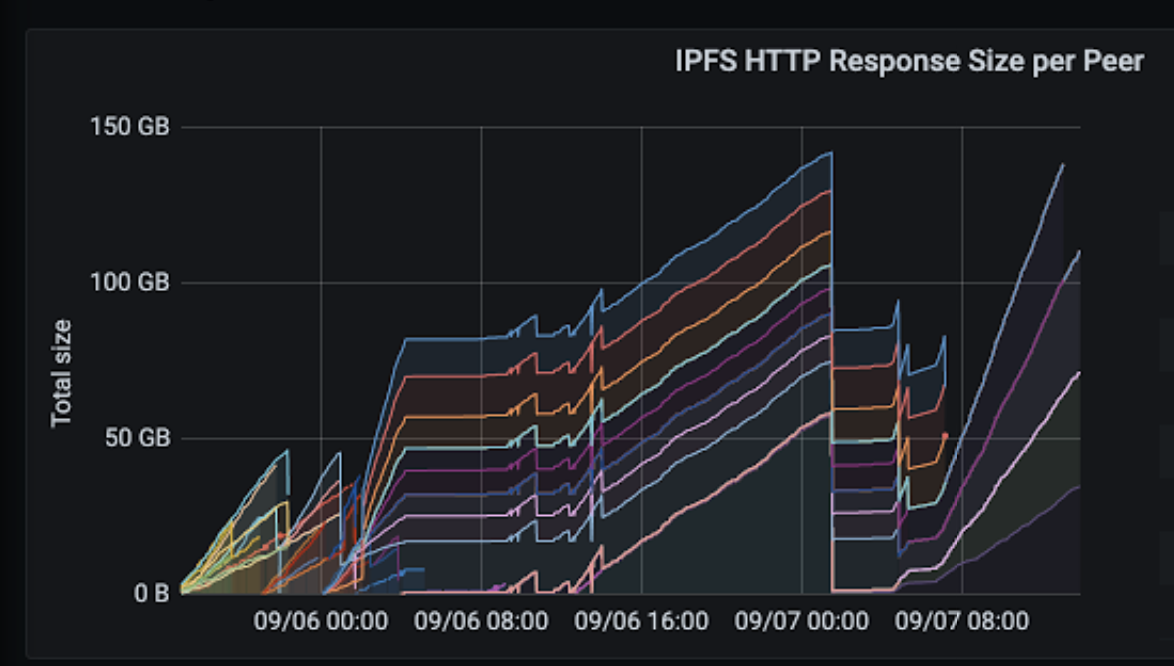
The following picture shows the HTTP response size per peer, or in other words, how much network traffic a peer receives from IPFS. It peaks at around 150GB of traffic after a duration of 30 hours. Deploying such an application on a real-world edge device such as a smartphone without an unlimited data plan will not work. One option would be to limit data transfer to situation where the device is connected to a WiFi network or similar. Another approach would be improving the efficiency of network communication in IPFS.
The memory usage per pod is shown in the following picture. It tends to be around 1 to 2 GB per pod and slowly increases during its lifetime as seen in the end of the diagram.

Scale-Up Benchmarks #
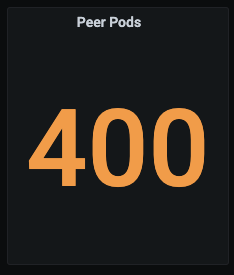
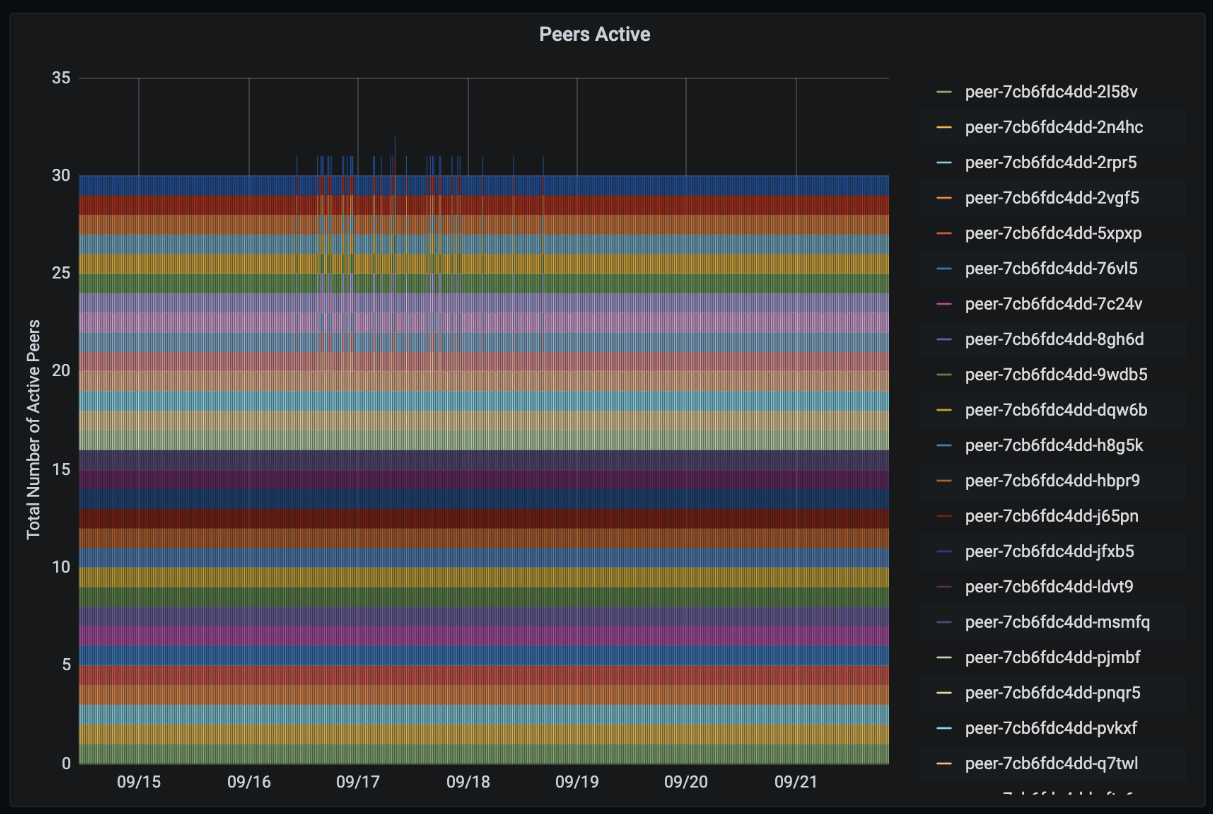
One very interesting parameter in a scale-up scenario is the number of peers a simulation can sustain. While the system was able to run 400 pods in parallel after some adjustments to Kubernetes, such a high number inevitably led to low-level errors and instabilities such as a errors in Kubernetes networking itself. Because of storage limitations described later we were only able to run 30 peers at the same time without experiencing any storage problems whatsoever even over very long benchmark runs.
Multiple challenges occurred during the conduction of the benchmarks.
The tip as well as consensus selection algorithm implementations started to fail after roughly 3000 published transactions due to the following error:
RecursionError: maximum recursion depth exceeded in comparison
Both selections did a recursive walk from the beginning of the tangle. This recursive walk started to become too deep once the 3000th transaction was published. Our solution was to re-write both implementation to use an iterative approach working with queues rather than recursion.
Counter-intuitively this issue was not prevalent in the conceptual simulation even though the same implementation of these algorithms was used. One reason for this could be that the Tangle is slimmer (i.e., more sequential transactions rather than many transaction at the same time) in practice than in the conceptual simulation. This makes sense because training on the peers does not happen at the exact same time for simulation performance reasons and therefore transactions happen at the same time more rarely. Hence, recursion grows deeper for the same number of transactions.

As mentioned before IPFS is relatively resource hungry. During scale-out it seemed storage requirements were the worst bottleneck for long running benchmarks. When scaling-up we saw the same behaviour due to the very low storage capacity of our simulation hardware. Therefore, after approximately 10 hours peers started to die because the containers were our of storage space.
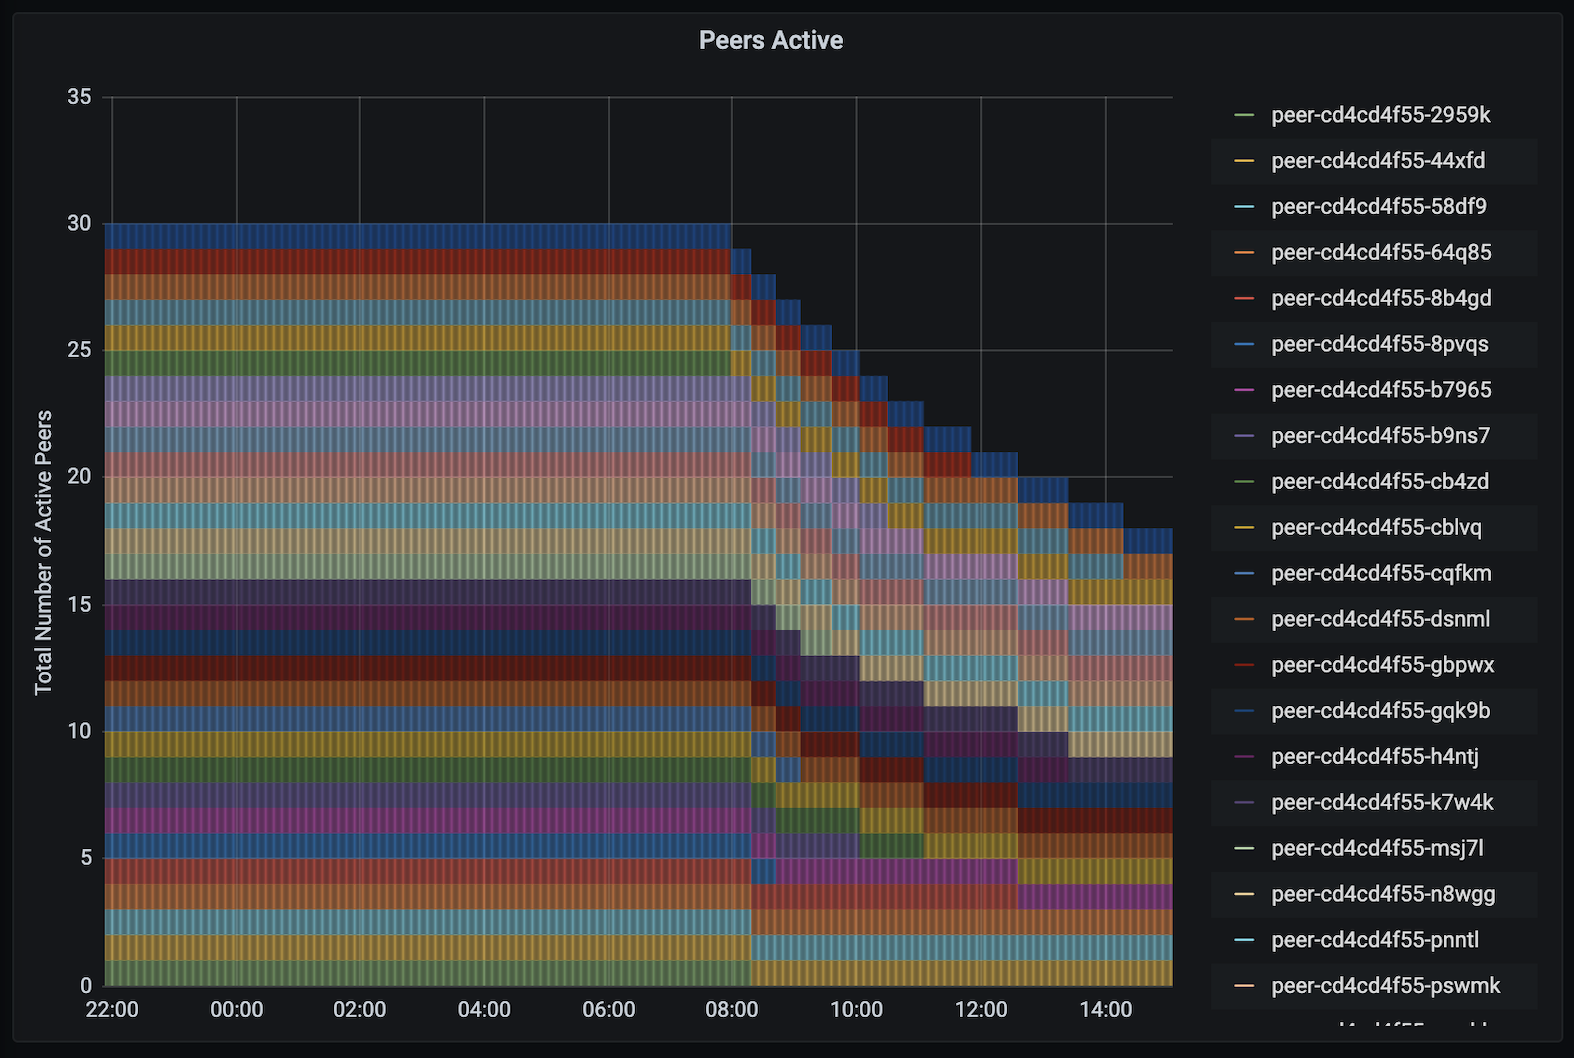
One solution we tested was increasing the frequency of garbage collection in IPFS. Garbage collection in IPFS will delete non-pinned data blocks. By default those are the blocks not published by the peer itself. We increased the frequency to hourly. The results can be seen in the following picture:

Training completely stopped after approximately one hour which coincided with the garbage collection run. A more in-depth investigation showed that some data blocks corresponding to available tips were not fetchable any more by at least some of the peers. Since garbage collection should not delete pinned weights every weight should still be available at least once (at the peer that originally published that transaction) in the network. Since this was clearly not the case we concluded that either the garbage collection falsely deleted pinned files or not all peers' data blocks where reachable within the whole network. The latter would indicate either a networking problem or, more likely, a problem of the IPFS routing or data localization implementations.
Since no new transactions could be published performance metrics stalled. To solve this and to make the prototype more resilient against data loss in general the tip and consensus selection would need to be rewritten. One approach is to to keep searching for other available tips if previously selected ones turn out to be unavailable. Furthermore, the unreachable transactions could be removed from each peer’s local view on the trangle after a few failed tries.
Since it is evident that increasing the frequency of garbage collection is not a solution to the storage challenge without additional work on resiliency, we sought a less costly solution allowing us to run longer benchmarks. The quickest solution is adding more storage or, in our case, using non-utilized RAM as additional storage by creating a RAM-Disk and mapping the containerd folders to these.
Highest Performance Achieved #
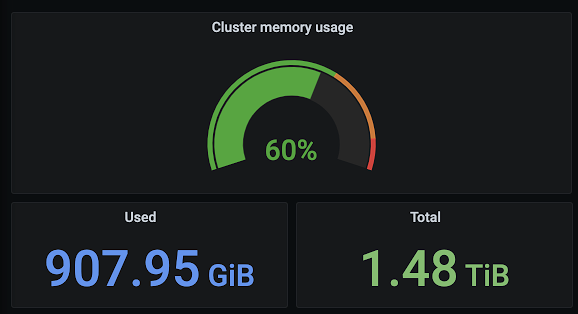
Our best benchmark ran more than 7 days with 30 peers and a training interval of 5 minutes. The accuracy achieved was approximately 0.4.
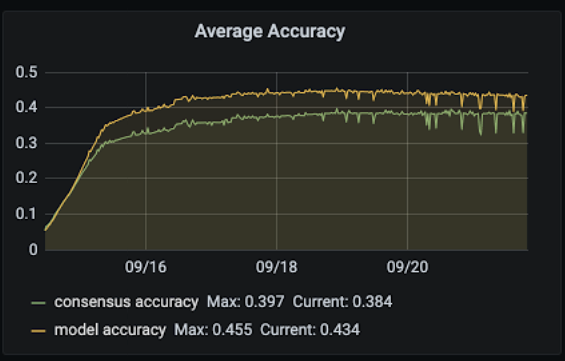
The following picture shows that the benchmark ran very stable at all times.
The next diagram reveals that the number of published transactions stalls after approximately 2 days.

Same as the response size rate per hour.
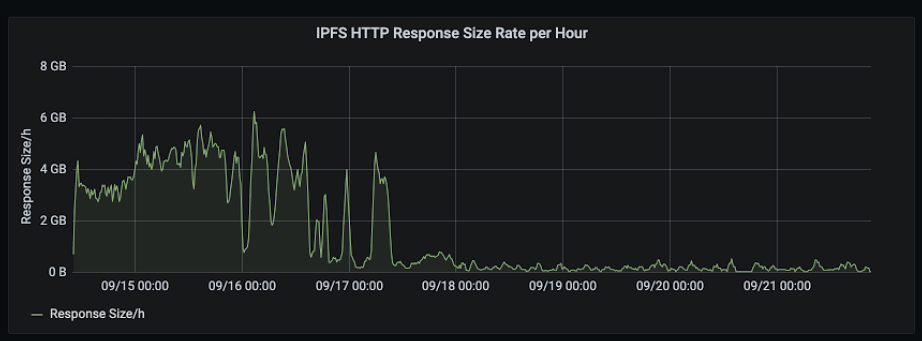
However, the average HTTP request duration is constantly increasing, which means that on average the duration until an http request is successful is increasing. Also the total number of IPFS requests was constantly growing, which means that IPFS constantly send out requests to other peers.
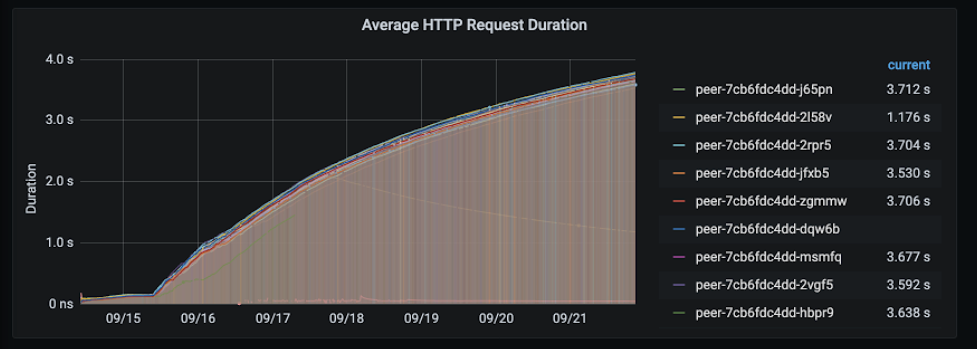

In conclusion, the metrics of our best benchmark show that communication on the IPFS level was almost constant during the full time of the run. This indicates that communication is working as expected in principle. The rapid decrease of newly published transactions as well as the stagnation of the model accuracy indicates that a problem exists somewhere in the tip selection algorithm’s implementation since the selected tips are not available which ultimately stops the training process and accuracy improvement. A possible solution that could further improve benchmark results is repeating the tip selection until an available tip is selected.